While cruise pamphlets and getaways to dream destinations may be in your plans for the next year, you may be surprised at how your next destination ranks when it comes to factors such as toxicity, cancer rates, water quality, sexual assaults, and murder. http://
Author: Admin
The Kids Aren’t Alright
Every country has its own traditions and celebrations when it comes to the birth of a child. In most societies, a child is a blessing to be celebrated. Once the child is born, however, they enter into a world full of perils. http://www.healthcare-
The Criminal States of America
When you turn on the news, it’s no surprise to see reports of violent crimes or robberies. You may see these stories affect your daily life, by being more wary of your surroundings, taking self-defense classes, or even starting a neighborhood watch program. But do you know how your state ranks compared to others in crime rates? http://www.
Produced By Criminal Justice Degree Hub
The Fight of the Century: Amazon vs. Netflix
When it comes to video streaming, there’s two media giants at war for your viewing dollars: Amazon and Netflix. http://www.business-
Line of Sight: How Times Have Changed
Whether you wear them for reading, or have to wear them full time, glasses are an invention many of us can’t do without. www.vspblog.comhas created an interesting infographic detailing the history behind the lenses in your classes, along with a clear look into the future.
Big Data, Small Footprint?
While browsing the internet, many people want to know how we are supplied with what seems to be an endless supply of data. Where does all this energy come from? What’s the impact it has on the environment? Well, http://www.
The Evolution of Medicine
There is no denying the fact that the past few centuries have brought a wealth of knowledge to the medical field. From antibiotics, to new surgeries and vaccines, we’ve seen a huge evolution in healthcare. http://www.bestmedicaldegrees.
Education in the USA
Infographic : THE COST OF PROM
Each spring, thousands of high school teens prepare for the biggest event of their high school career – prom. This tradition, which started back in the 1800s at Ivy League colleges, has become one of the most expensive outings for high school students and their parents to afford.
Prom has grown into an all out gala over the years. Once a traditional dance held on college campuses, proms today include extravagant venues, elaborate wardrobes, and over-the-top “after-prom” plans.
In 2013 alone, the average cost of prom was over $1,400. Come spring of 2014, the cost of prom is projected to total over $1,900. Most often, this comes as an expense to parents, though it has recently become a trend for students to help offset some of the costs associated with prom.
Also, another interesting trend is the fact that single parents and families with annual incomes under $50,000 spend more on prom. For a closer look at what is purchased for prom and who pays the bill, check out our Cost of Prom Infographic.
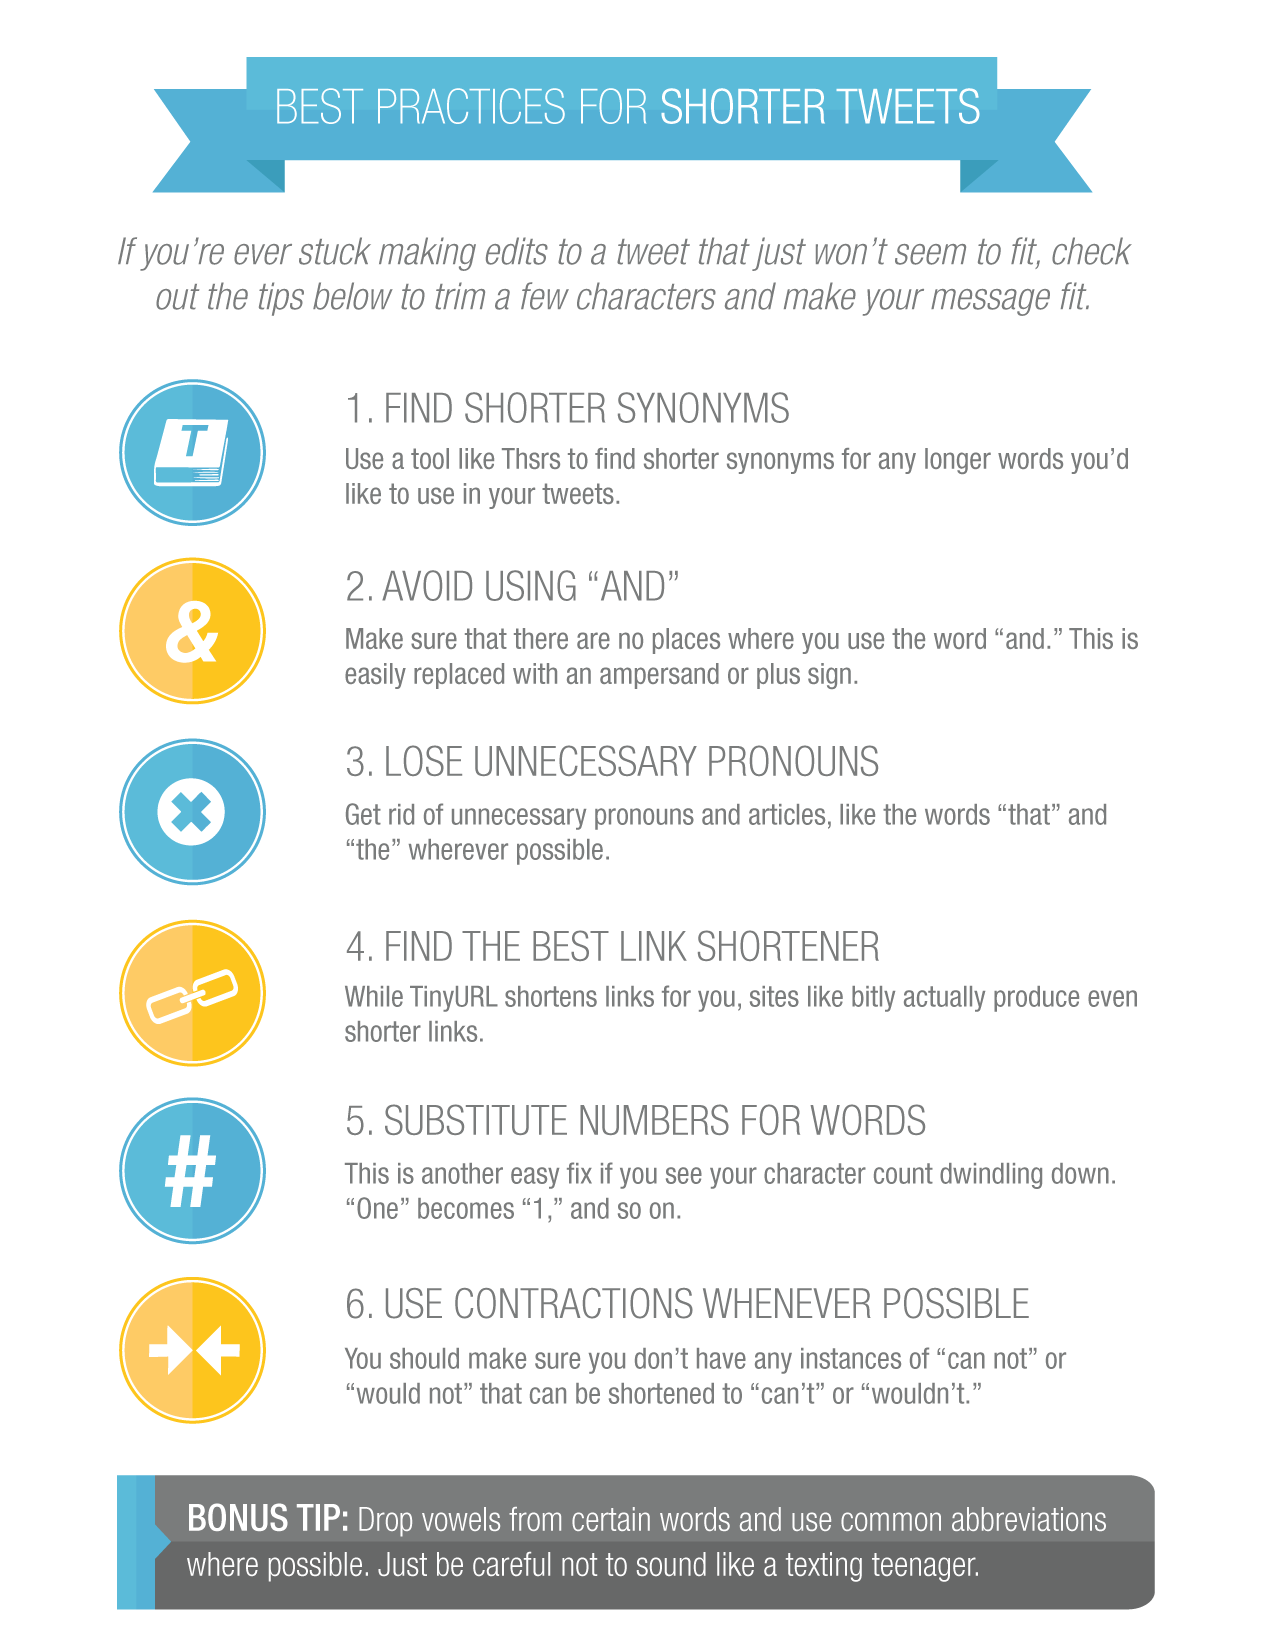
Infographic : Best Practices for Shorter Tweets
Marketing experts are constantly on the search for engaging, attention-grabbing tweets. However, stuffing a full marketing message into 140 characters or less can be a huge challenge-especially when you have a lot to say! www.pardot.com has created an infographic entitled “ Best Practices for Shorter Tweets ” giving you tips to making the most out of those short but sweet tweets.


