Chances are, you or someone you know has been diagnosed with some type of learning disability. It is estimated that 4-6% of the population in the United States has some type of learning disability. While many view these individuals as lacking in intelligence, this couldn’t be further from the truth. www.special-education-
Author: Admin
Infographic : Are Americans Becoming More Health-Conscious?
Americans are buying more veggies and fewer cigarettes, carbonated soft drink sales continue to drop, and the fitness sector has grown 12% since 2007.
But are all these changes in habits really paying off?
The following infographic by mint.com explores whether or not this shift is actually improving Americans’ overall health.
Infographic – Driven Insane: Road Rage
It’s happened to all of us. From another driver cutting us off, to the dreaded one-finger-salute, everyone on our roads has experienced road rage. Best Counseling Degrees has created an infographic detailing the facts behind road rage, and how to avoid it.
Infographic : Brain Trust
Scientific research and development may be a controversial subject, but www.superscholar.org has created a fact-packed infographic detailing everything you need to know about the current affairs-and the future-of scientific research and development spending, entitled “ Brain Trust ”.
The United States spends more on scientific research and development than any other country in the world. Asia, however, spends more as a region-with 36.7% of all funds originating in the Asia region. This is closely followed by the Americas at 36%, and Europe placing third at 24.1%. But where does this money go? The infographic details, by country, where that money ends up. The United States designates their funds for national defense, health, and space/flight research. China spends their R&D dollars in areas like nanotechnology, clean energy, stem cell research, and new labs/institutes.
Why should you choose a custom design for your business
Design – the language, which we use to tell the world about our product, solution or proposition. The success of the design at the targeted audience of the project depends on how “literately” we will build the phrase. If we try to explain it using a foreign language, then we will build the phrase totally wrong way, violating grammar rules, sentence structure, as well as interchange the keywords position, unlikely to understand us. That is to say totally won’t understand, or may understand something totally different, something we didn’t mean at all. And even can take offense.
Infographic Source :- dezayo.us

Boo! Why Are Americans Spooked to Spend on Halloween 2013? (infographic)
Why is Halloween 2013 scaring consumers off?
Is is the fake blood? The spooky decorations? The impending zombie apocalypse?
Probably not.
The real fright is in our wallets.
Via :- mint.com
Online Trading Academy – 2013 Halloween Spending
The Online Trading Academy has created a scary infographic to show the Halloween economy. It compares Halloween to other national holidays financially. When you think of Halloween, it doesn’t seem to be that expensive as other national holidays. However, if you wrote down everything you purchase for the holiday such as, candy, costumes, and cards, you would be surprised at the amount that your spending. Take a look at the scary infographic created by Online Trading Academy to get an overview of the Halloween economy.
The State of Children’s Health
Evolution of the Easy Bake Oven
Easy Bake Ovens singlehandedly revolutionized the toy industry, making it into the top 100 toys ever made. http://www.partselect.
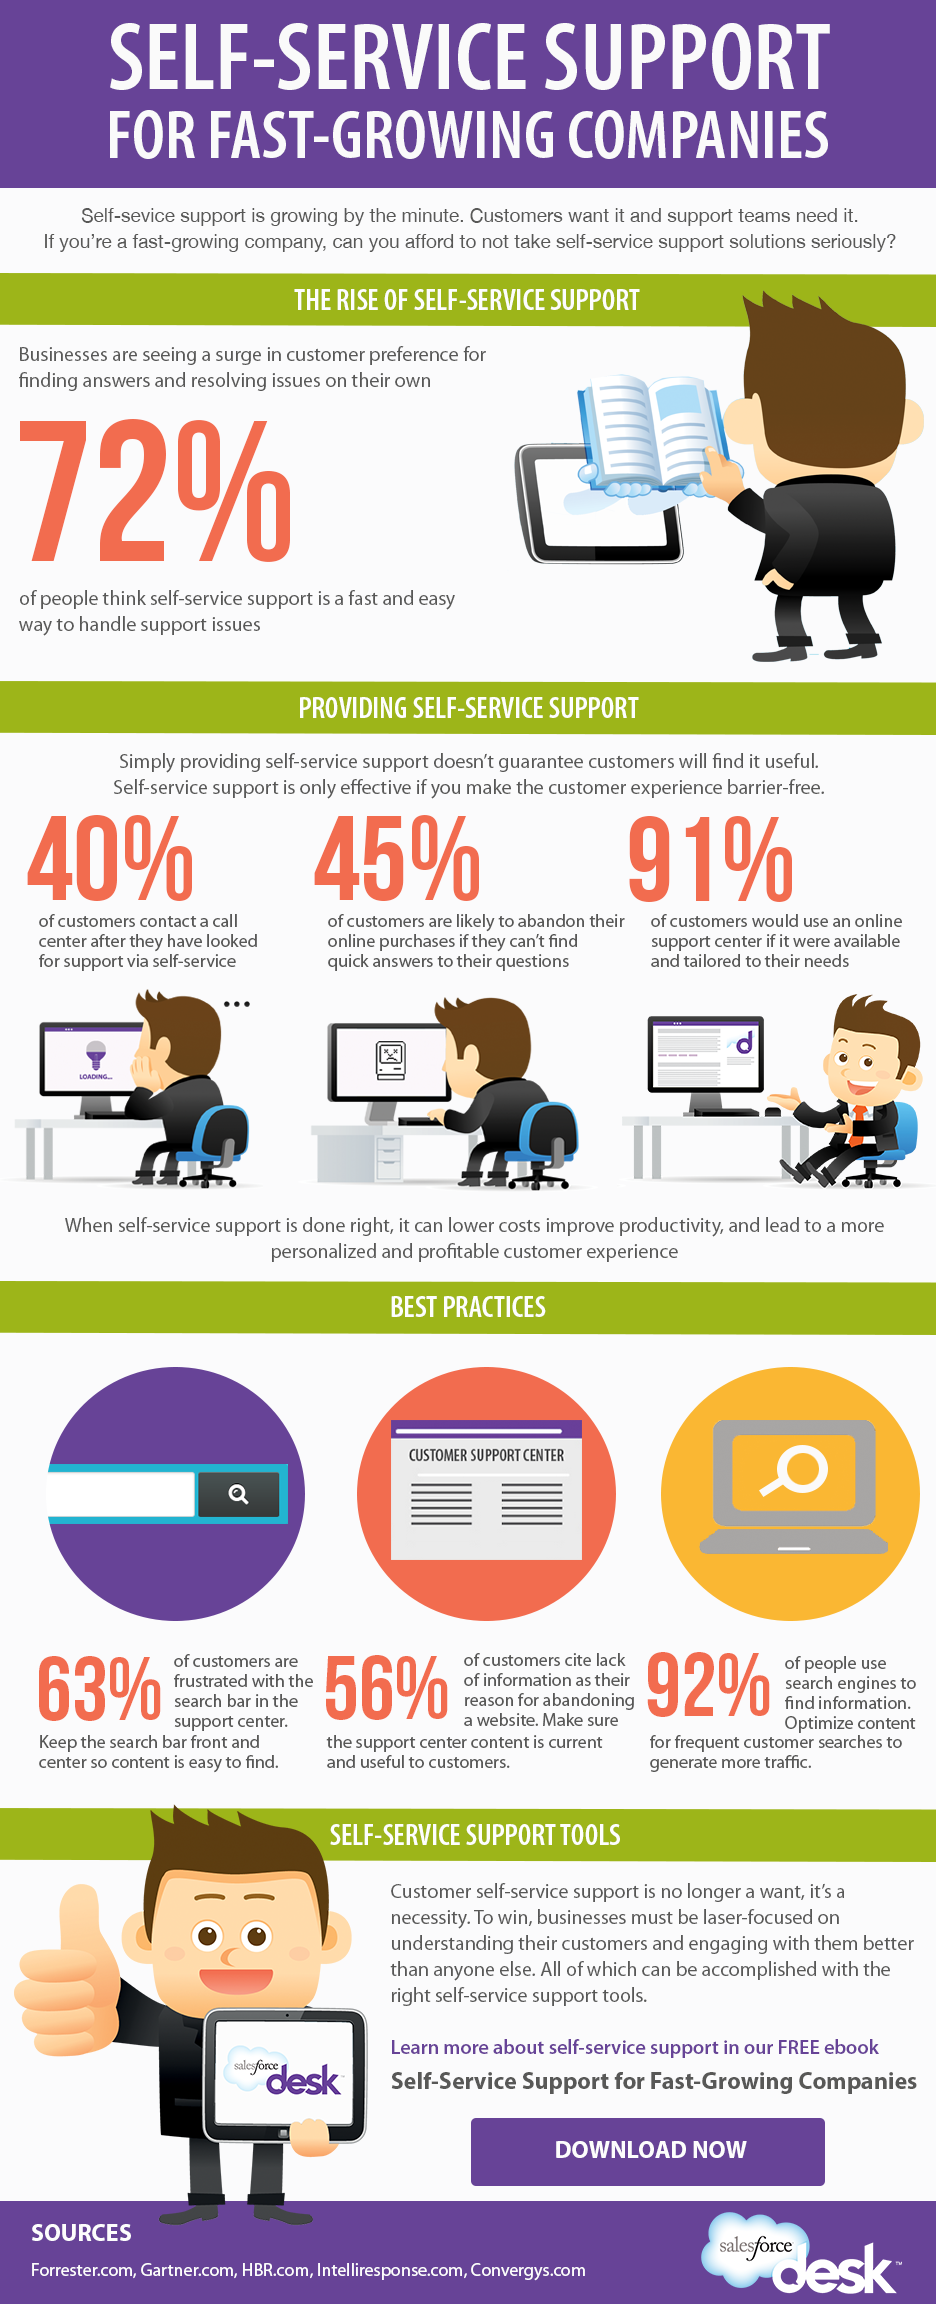
Self-Service Customer Support
One area where businesses may struggle the most is customer support. Whether it be a lack of information, or trouble finding resources, getting help to your customer is a necessity in today’s marketplace, and is essential for customer satisfaction. www.desk.com


