There is no denying the fact that the past few centuries have brought a wealth of knowledge to the medical field. From antibiotics, to new surgeries and vaccines, we’ve seen a huge evolution in healthcare. http://www.bestmedicaldegrees.
Tag: Infographic
Infographic : THE COST OF PROM
Each spring, thousands of high school teens prepare for the biggest event of their high school career – prom. This tradition, which started back in the 1800s at Ivy League colleges, has become one of the most expensive outings for high school students and their parents to afford.
Prom has grown into an all out gala over the years. Once a traditional dance held on college campuses, proms today include extravagant venues, elaborate wardrobes, and over-the-top “after-prom” plans.
In 2013 alone, the average cost of prom was over $1,400. Come spring of 2014, the cost of prom is projected to total over $1,900. Most often, this comes as an expense to parents, though it has recently become a trend for students to help offset some of the costs associated with prom.
Also, another interesting trend is the fact that single parents and families with annual incomes under $50,000 spend more on prom. For a closer look at what is purchased for prom and who pays the bill, check out our Cost of Prom Infographic.
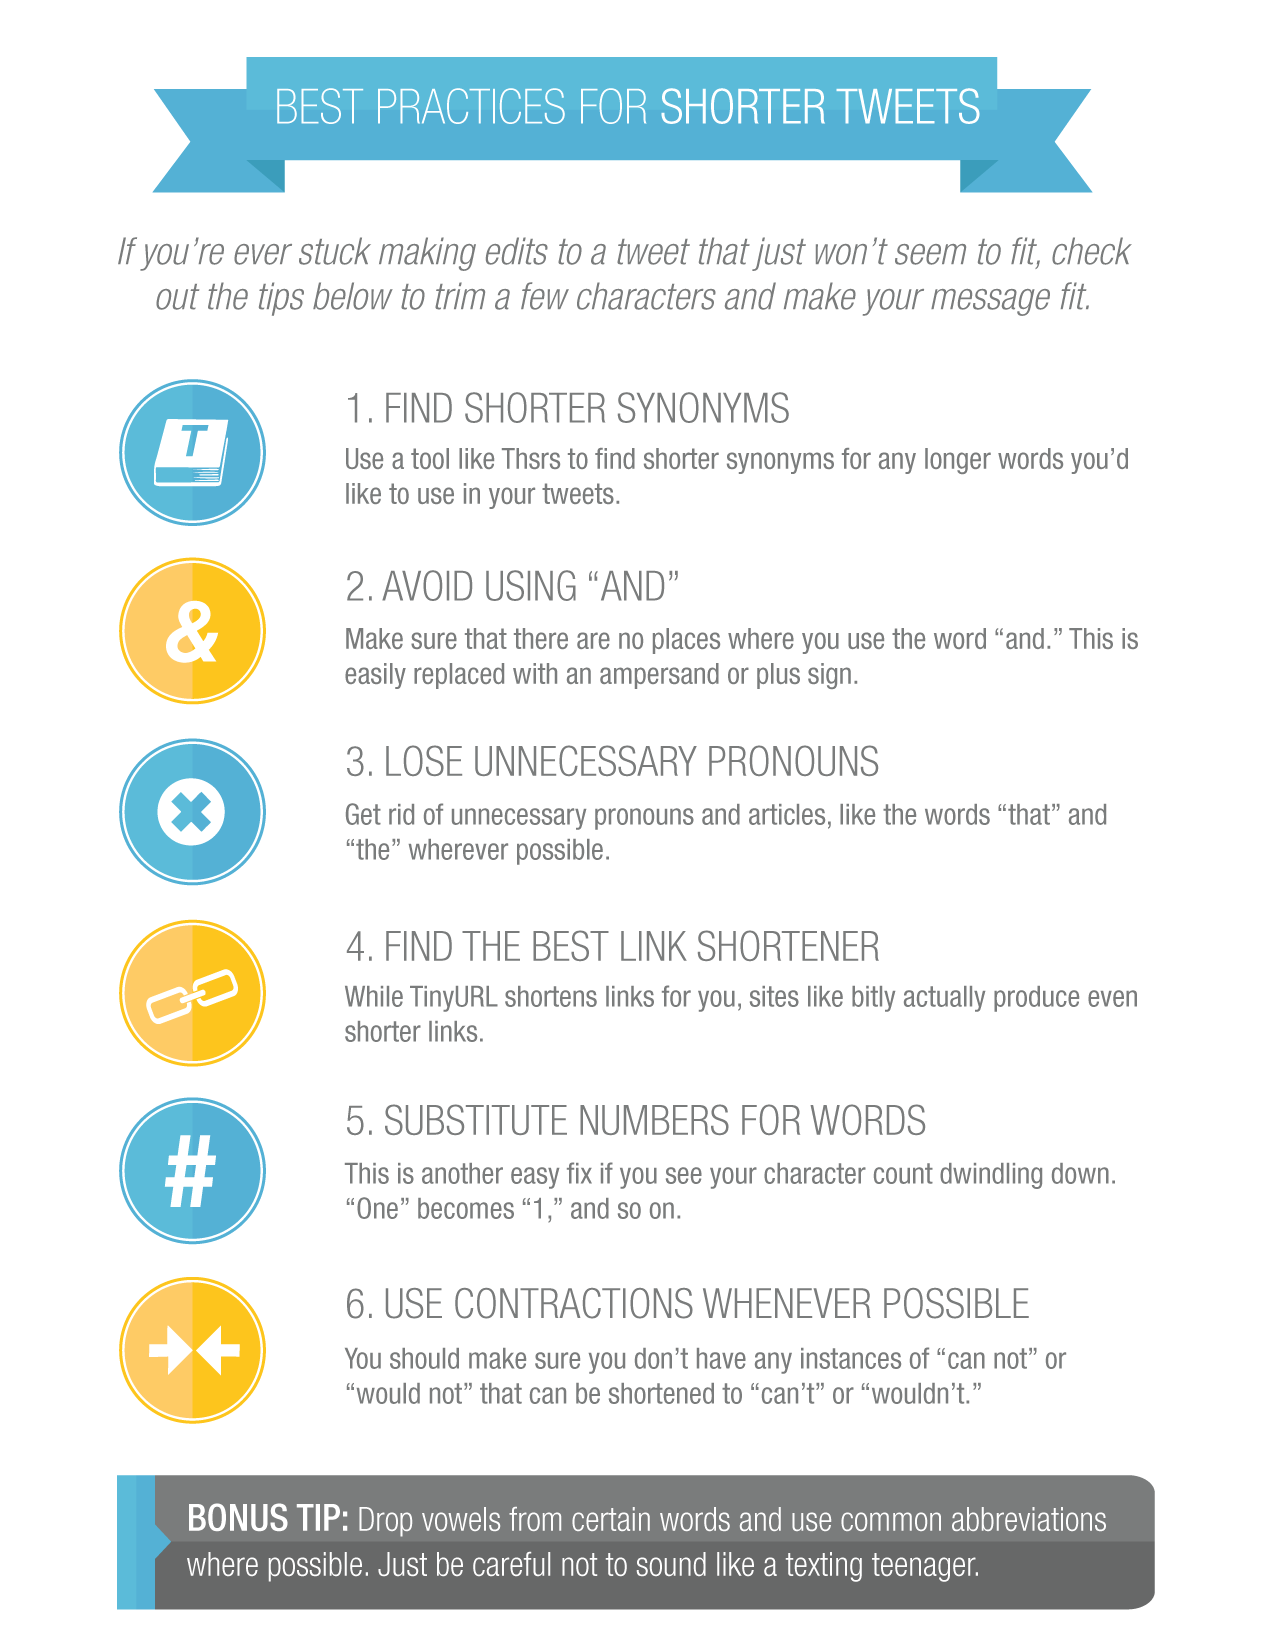
Infographic : Best Practices for Shorter Tweets
Marketing experts are constantly on the search for engaging, attention-grabbing tweets. However, stuffing a full marketing message into 140 characters or less can be a huge challenge-especially when you have a lot to say! www.pardot.com has created an infographic entitled “ Best Practices for Shorter Tweets ” giving you tips to making the most out of those short but sweet tweets.
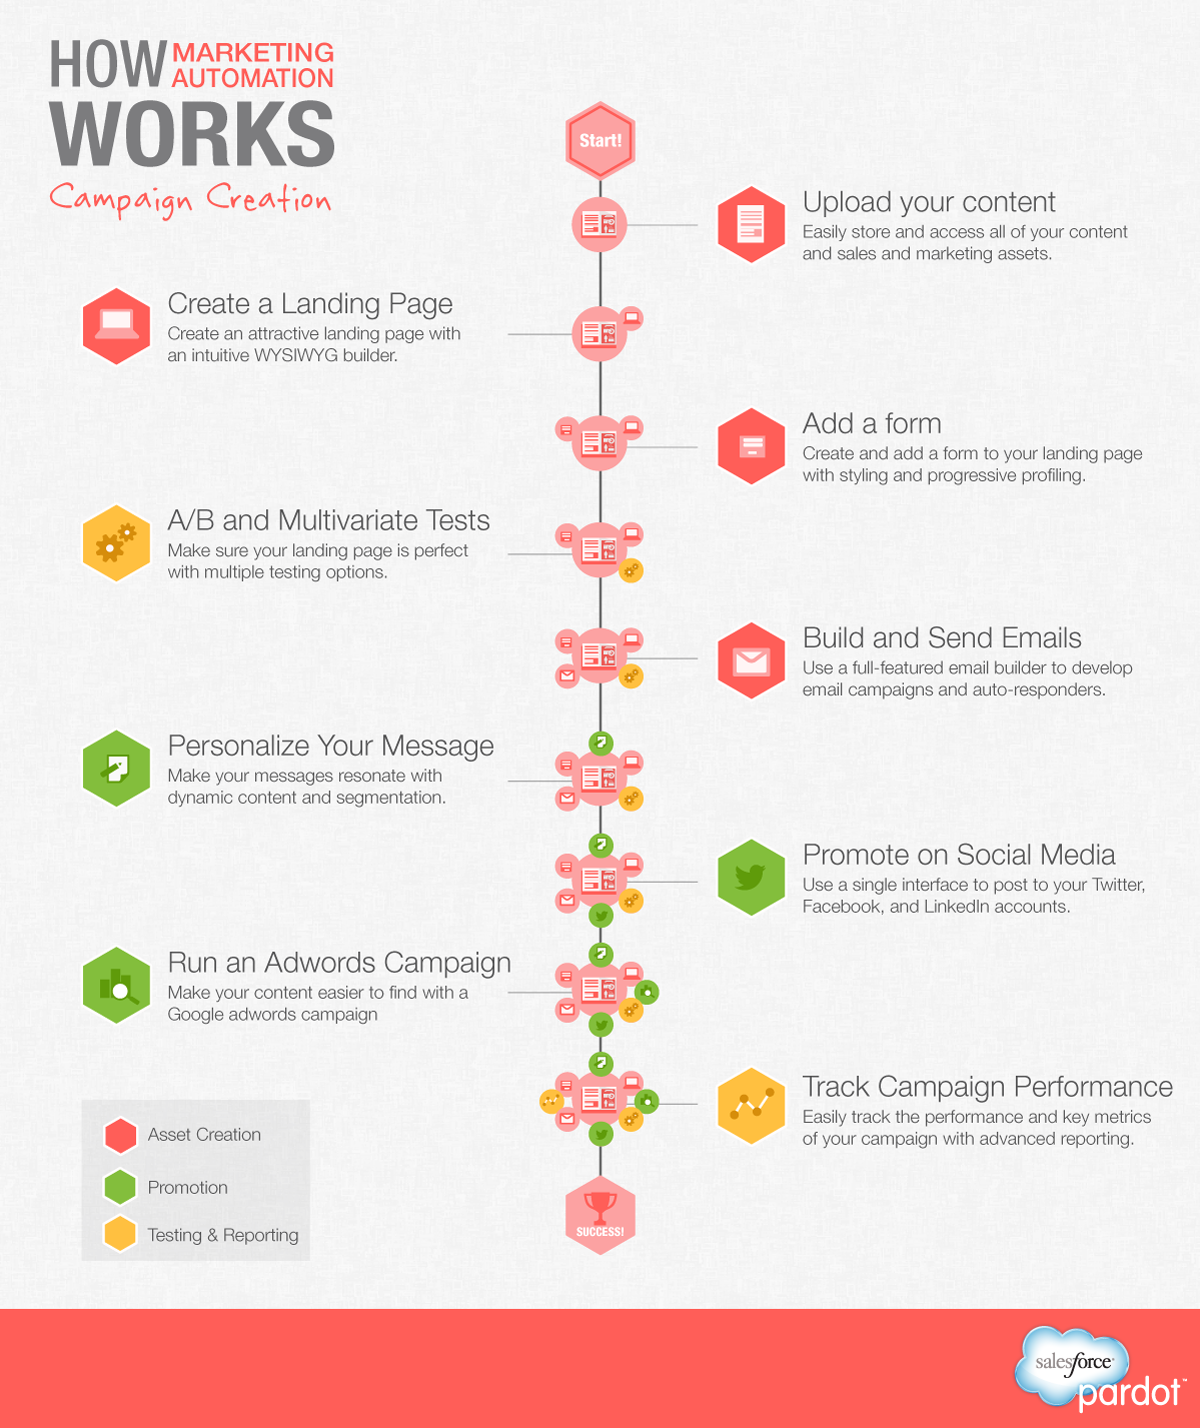
Infographic : Marketing Automation
Running a successful marketing campaign can seem impossible. There are so many outlets, and so many details to nail down. www.pardot.com has created an infographic entitled “How Marketing Automation Works” detailing how marketing automation can help you create and run marketing campaign, along with a useful guide to ensure success.
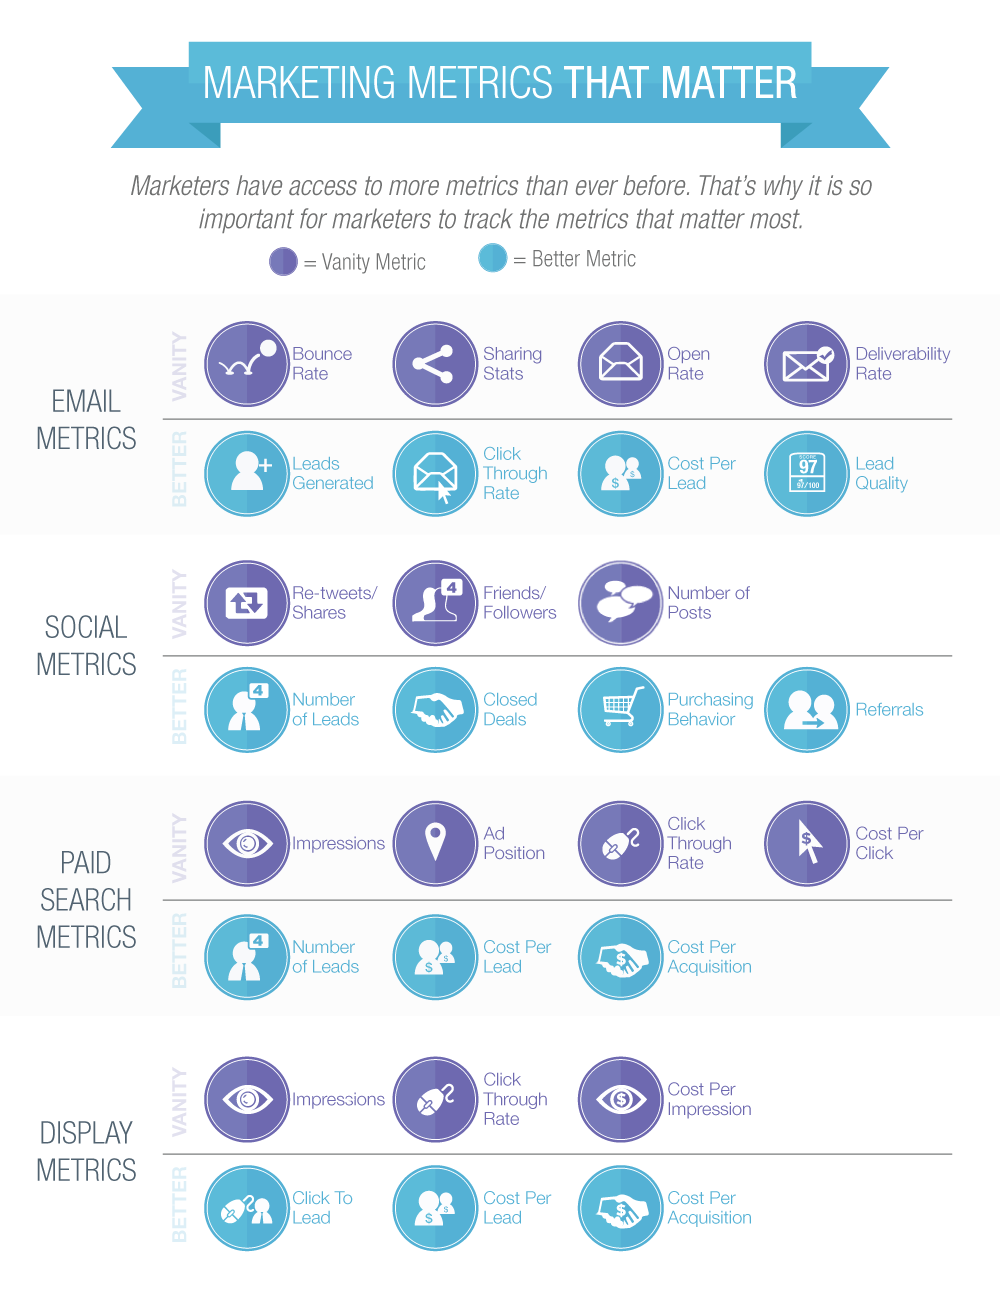
Marketing Metrics that Matter
Marketers are constantly on the search for useful metrics. While knowing baseline metrics is always a good thing, deciding which of those metrics are valuable-which ones turn into leads-can be confusing. www.pardot.com has created an infographic entitled “ Marketing Metrics that Matter ”, which outlines most of the marketing metrics available, and separates them into useful categories (Better Metrics), and the not so useful (Vanity Metrics). Print this up, discuss it with colleagues, and start getting metrics that will make a difference to your marketing strategy!
Sales and Marketing: The Original Game of Thrones
There’s no doubt about it: The workplace can be a battlefield, and there are some very heavy hitters vying for control. www.pardot.com has created an infographic entitled “Sales and Marketing: The Original Game of Thrones” exploring the different sides of the fight, and how we may all find workplace peace one day thanks to marketing automation.
Infographic : Household Germs that can Kill
Here is an infographic about the deadliest household germs in the World including MRSA, E. Coli 0157, Novovirus and C. Difficile. Learn about how many deaths in the UK each one causes and the most common places they can be found in your home.
Infographic Source :- master-cleaners.co.uk
Apple’s Biggest Failures
Apple may be one of the largest, most successful companies in the world, however, they’ve had their share of flops when it comes to technology offerings.http://www.masters-in-finance.
Biological Attack: Are We Ready?

Source: SecurityDegreeHub.com
Decipering Your Financial Award Letter
Infographic Source :- www.citizensbank.com


