Tag: Infographic
Facebook facts
The rise of Facebook madness is really something which no body can ignore. It is very tough to find someone in this planet who is not a member of Facebook. From a high school student to some one more than 80 years old every one is subscriber of this social media. Even professionals are also using Facebook for increasing their business. Facebook is considered more addictive than cigarette and alcohol.
Facebook has also become the third largest video website with 46.6 million viewers sitting behind number one ranked property provider Google with its YouTube site and Yahoo at second ranking.
Last year Facebook surpass Google for the top ranking for total time spent online. Asians are the hardcore user of Facebook followed by America and European countries. For some of us their day start with surfing Facebook and also end their day doing the same.
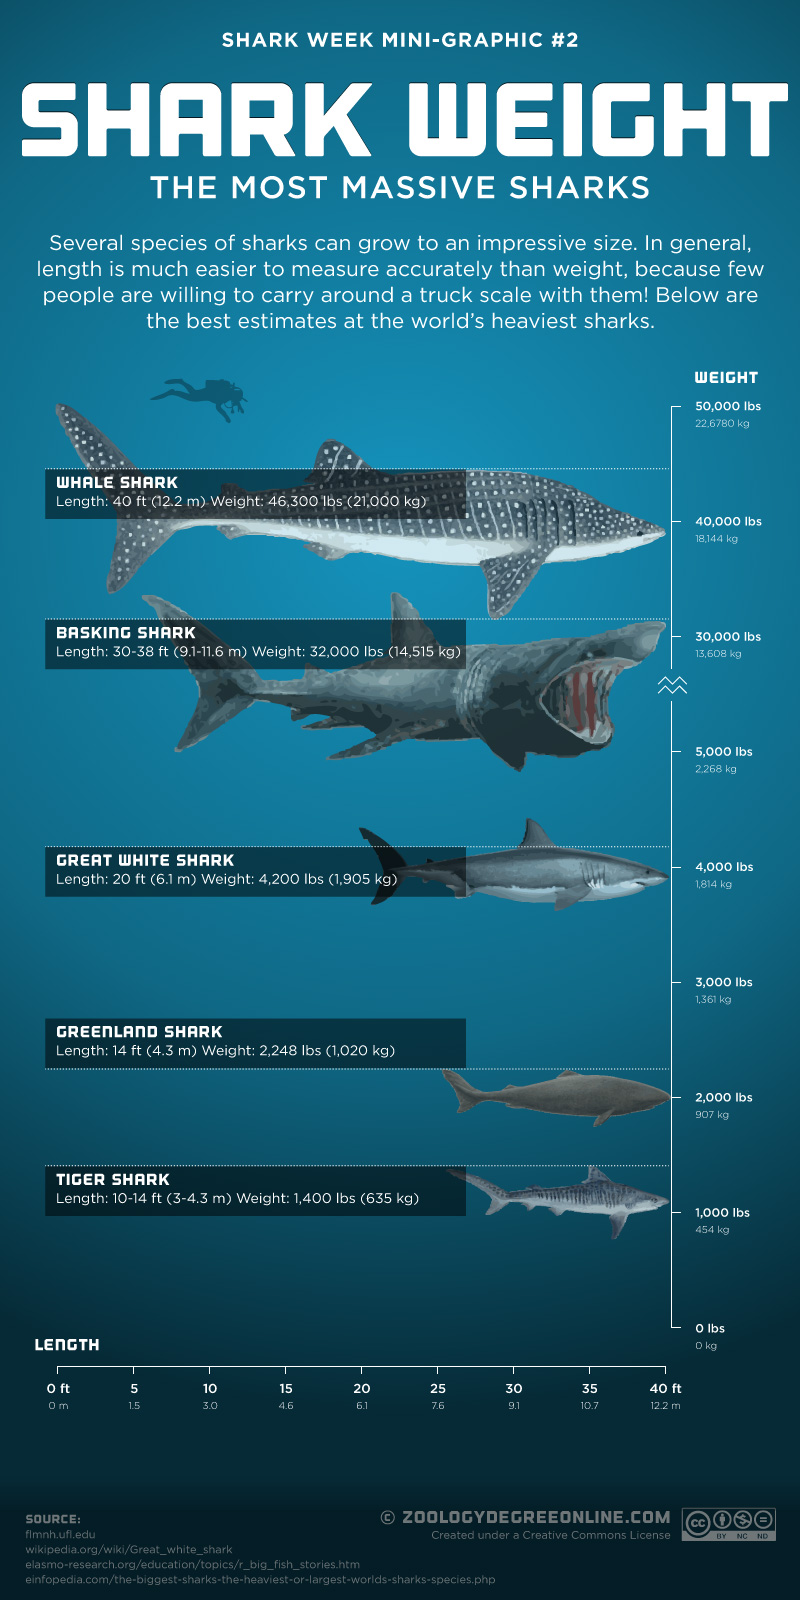
Shark Weight – The Most Massive Sharks
It may surprise you just how massive some sharks are. The largest shark, the whale shark is 2 feet longer than a typical school bus and weighs more than twice as much! (The average 38? 84 passenger school bus weighs between 22,000-28,000 lbs). Luckily for us and most of the sea creatures out there, the two largest sharks alive today feed mostly on plankton. That makes the Great White the largest predator shark. On the other end of the scale the Dwarf Lanternshark is currently the smallest known shark, reaching only 8.3 inches (21.2cm) in length.
Killing Time: How to Destroy Your Productivity [Infographic]
A study at The British Institute of Psychiatry showed that checking your email while performing another creative task decreases your IQ in the moment by 10 points. That is the equivalent of not sleeping for 36 hours. This mundane task is just one of many everyday work habits that may be standing in the way of your company’s efforts to boost productivity and increase sales.
From constantly being interrupted and switching tasks at random, to creating an impossibly long to-do list and cluttering your desk, here are seven steps to ensure that you are decreasing productivity and overall sales effectiveness on a daily basis.
Build Your Website
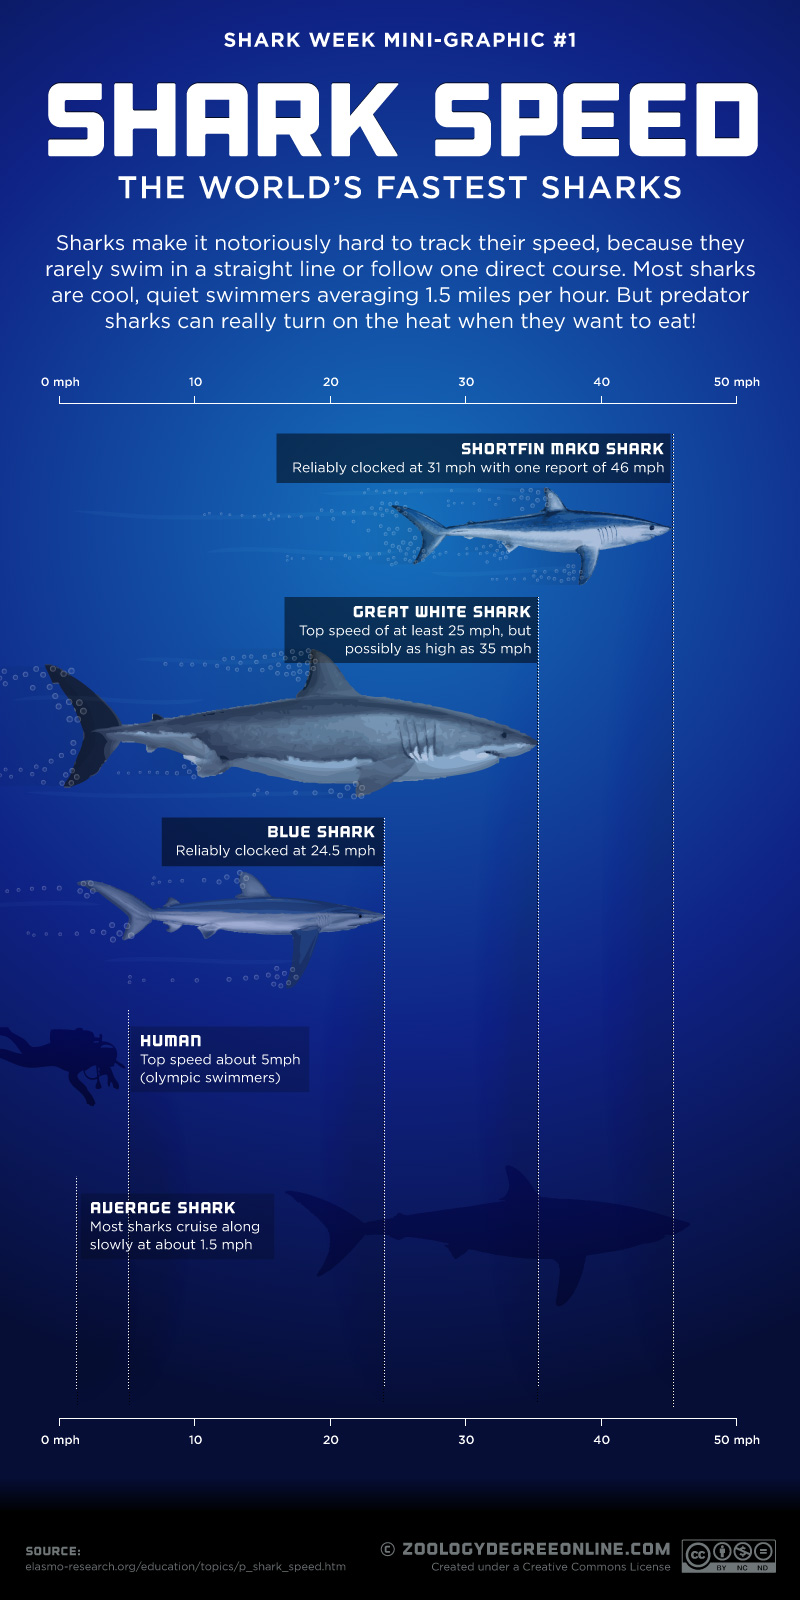
Shark Speed – The World’s Fastest Sharks
Infographic: Have enough auto insurance?
Infographic: Bizarre and Unusual Economic Indicators
Economists and financial experts use a variety of indicators when attempting to analyze the state of the economy. Among the countless indicators on the expansive list are a few that are humorous, unusual, and downright bizarre.
From cosmetic surgery, to Egg McMuffin sales, to the width of a man’s tie, the following infographic explores some of the more novel indicators used to measure how well the economy is performing.


![Killing Time: How to Destroy Your Productivity [Infographic] Killing Time: How to Destroy Your Productivity [Infographic]](http://www.infographicsking.com/wp-content/uploads/2012/08/Killing-Time.png)


