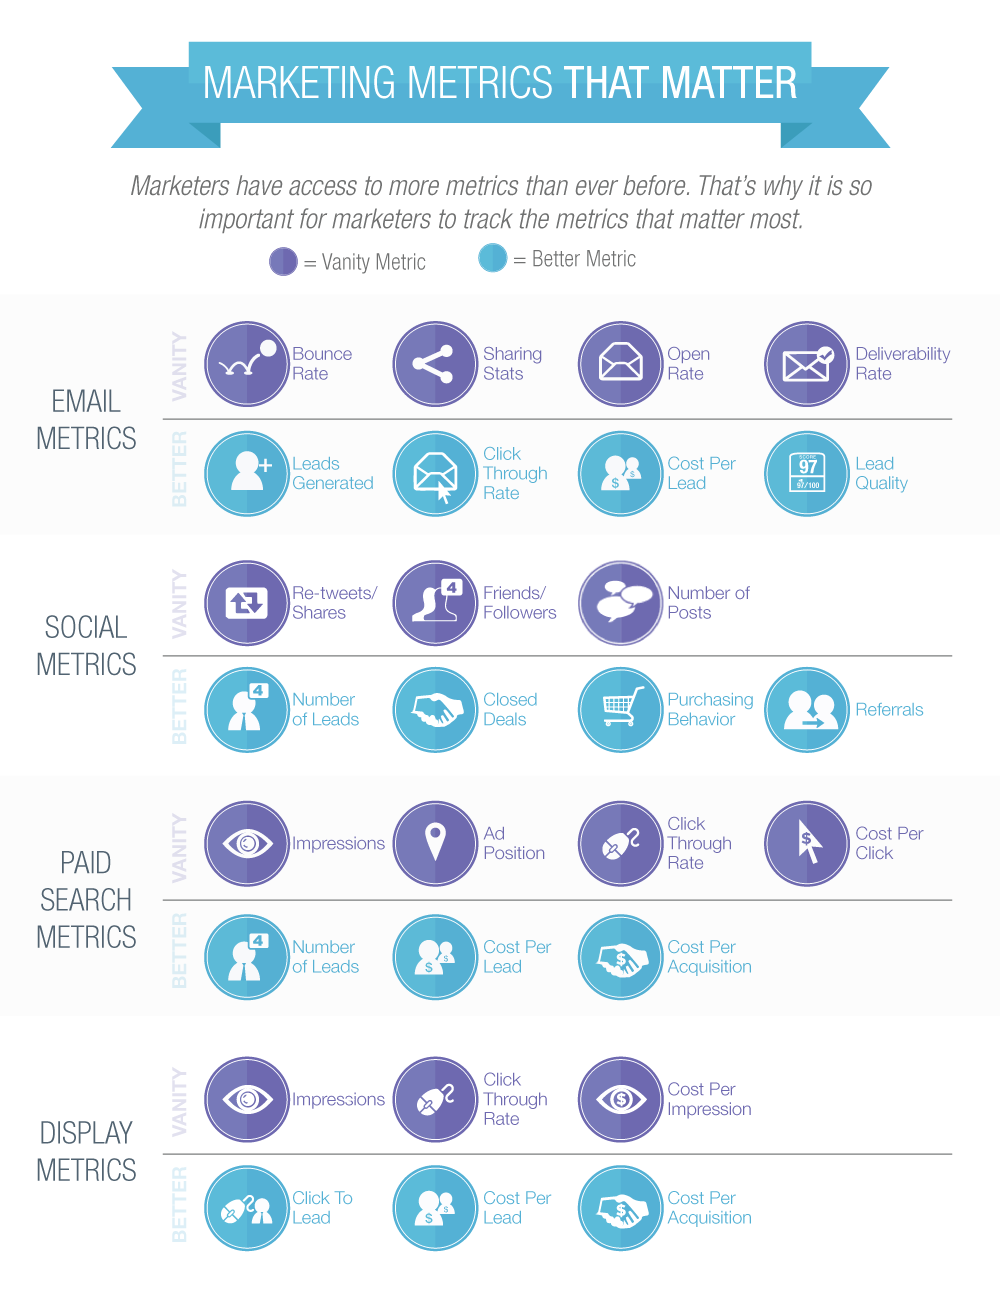
Marketers are constantly on the search for useful metrics. While knowing baseline metrics is always a good thing, deciding which of those metrics are valuable-which ones turn into leads-can be confusing. www.pardot.com has created an infographic entitled “ Marketing Metrics that Matter ”, which outlines most of the marketing metrics available, and separates them into useful categories (Better Metrics), and the not so useful (Vanity Metrics). Print this up, discuss it with colleagues, and start getting metrics that will make a difference to your marketing strategy!
-
Ignoring Heart Disease Won’t Lower Your Risk Jan 25, 2013
-
Education’s Effect on Income Apr 24, 2012
-
The Superbowl – Champion of all Brands Jan 29, 2014
-
Mental Illness in America Aug 15, 2014
-
All About Gum Diseases Dec 1, 2021
-
Infographic : The Hindu Festival Of Dussera Oct 11, 2021
-
Features Of HRAPPs Employee Monitoring Software Aug 6, 2021
-
An Insight To The RPO Models Jun 16, 2021
-
An Insight To Various Recruitment Stages Jun 16, 2021
-
bellajones on Infographic : How Invoice Financing Can Save Your Business
Thanks for sharing
-
Adelaide on In Online Advertising, 2011 Was the Year of Mobile [Google Benchmarks]
Thanks for your thsuohtg. It's helped me a
-
bellajones on Infographic : Your own guide to investing in property in Singapore
Thanks for sharing the post among your
-
bellajones on Infographic : An outlook on Malaysia’s property market
Thanks for providing the complete information through (...)
-
zahid on OPPO Launches #SelfieExpert F1 in India
this is the nice and
-
Nishanth on Bed & Breakfast-The Rescuer of Mumbai City
Mumbai is a beautiful city with beautiful hotels.We need to (...)

